Free sample chapter from FRM Level I: Financial Markets and Products I.
Chapter 1: Banks — Risks, Capital and the Business Model
Chapter 1: Banks — Risks, Capital and the Business Model
A bank is the only kind of firm whose product is its balance sheet. A manufacturer's balance sheet records what it owns in order to make something else; a bank's balance sheet is the business. Every risk in this chapter, and most of the products in the six chapters that follow, exist because a bank funds long, illiquid, uncertain assets with short, liquid, certain liabilities — and is paid for the difference.
Our subject is Ravensmoor Financial Group, the mid-sized bank holding company that runs through this whole series. Its chief risk officer, Ingrid Halvorsen, is preparing for a board meeting with two items on the agenda. The first is routine: confirm that the group is adequately capitalised. The second is not: the board wants to know whether last year's securitization programme — which the finance division has reported as releasing $60.80 million of capital — was worth doing.
By the end of this chapter you will have answered both, and the second answer will be roughly half the number the board was given.
- $3,000M Total risk-weighted assets (from $3,000M of assets, of which $2,500M is credit risk)
- $192.00M Regulatory capital on the loan book (against $161.75M of economic capital at 99.9%)
- $30.80M Capital relief actually delivered (against $60.80M claimed, for $1.62M of expected loss moved)
Learning Objectives
Learning objectives
- Name the major risks a bank runs and trace each one to the activity that creates it
- Distinguish economic capital from regulatory capital and compute each on the same $2,400 million loan book
- Summarize the Basel minimum ratios, the buffers above them, the leverage ratio and the liquidity standards, and explain what each was a response to
- Explain the moral hazard created by deposit insurance and quantify the cross-subsidy a flat premium produces
- Rank the ways of raising capital through an investment bank by how much pricing risk each one leaves with the issuer
- Identify the conflicts of interest across a banking group's divisions and the controls that contain them
- Classify a position into the banking book or the trading book and state the capital consequence of the choice
- Explain originate-to-distribute, and compute the regulatory capital relief a securitization delivers once the retained tranche is treated correctly
1.1 The Risks a Bank Runs, and Where They Come From
The exam asks you to identify a bank's major risks and explain how they arise. The second half is what earns marks: every risk below is the by-product of a specific activity, and naming the activity is how you tell two risks apart when a question describes a loss without labelling it.
Credit risk The risk that a borrower or counterparty fails to make a payment it owes. It arises from lending, from holding bonds, and from any derivative or settlement exposure where the bank is owed money it has not yet received.
Credit risk is Ravensmoor's largest exposure and the reason $2,400 million of commercial loans sits on its balance sheet. It arises whenever the bank has performed its side of a bargain before the counterparty has performed theirs. Note that this includes positions that look like market risk: a profitable interest rate swap is a credit exposure to the counterparty for the amount by which it is in the money.
Market risk is the risk of loss from movements in prices — interest rates, equity prices, exchange rates, commodity prices, credit spreads. It arises from positions the bank holds deliberately for trading, and from positions it holds structurally. A bank that funds thirty-year fixed-rate mortgages with overnight deposits has an interest rate position whether or not anyone intended to take one.
Operational risk is the risk of loss from failed internal processes, people and systems, or from external events. It arises from everything — which is what makes it hard. Fraud, a mispriced trade booked into the wrong system, a failed settlement, a cyber intrusion, a fine for mis-selling, a fire in a data centre. The curriculum's own examples run from rogue trading to natural disaster.
Liquidity risk has two distinct forms, and conflating them is a classic exam error:
- Funding liquidity risk is the risk of being unable to meet obligations as they fall due. It arises from the maturity transformation at the heart of banking: deposits are repayable on demand and loans are not.
- Market (or trading) liquidity risk is the risk of being unable to exit a position at anything near its marked value. It arises from position size relative to market depth, and it shows up precisely when it is least welcome, because everyone wants to sell the same thing at once.
Beyond those four, a bank also runs business and strategic risk (revenues fall because the business model stops working), reputational risk (customers and counterparties withdraw because of what the bank is believed to have done), and legal and compliance risk (losses from litigation, regulatory penalties, or contracts that turn out not to say what the bank thought).
How the exam separates these
Questions usually describe a loss and ask you to classify it. The discriminator is the cause, not the symptom. A trader exceeds a limit and the position then loses money on a market move: the market move is the symptom, the control failure is the cause, and the loss is operational. A counterparty on a profitable swap defaults: the position was market-driven but the loss came from non-payment, so it is credit. A bank sells assets at a discount because it needs cash today: the discount is a liquidity loss even though it is realised through prices.
These risks interact rather than stack. A credit shock becomes a liquidity shock when funders notice, and a liquidity shock becomes a market loss when assets have to be sold into it. That interaction is why a bank holds capital centrally rather than per desk, which is the subject of the rest of this chapter.
1.2 Ravensmoor's Balance Sheet, and the Number Regulators Look At
Here is the group as Halvorsen's team reports it, in millions of dollars.
| Assets | Amount | Funding | Amount |
|---|---|---|---|
| Cash and central bank reserves | $150 | Customer deposits (insured) | $2,400 |
| Government securities | $350 | Wholesale funding | $270 |
| Commercial loans | $2,400 | Subordinated debt (Tier 2) | $75 |
| Other assets | $100 | Common equity (CET1) | $255 |
| Total assets | $3,000 | Total funding | $3,000 |
A regulator does not ask how large the balance sheet is. It asks how risky it is, and it does so with a deliberately crude instrument: every asset is multiplied by a risk weight, and the results are added.
Risk-weighted assets (RWA) The sum of a bank's exposures, each multiplied by a weight reflecting its riskiness. Cash and government securities of high-quality sovereigns carry a 0% weight; ordinary corporate loans carry 100%; some exposures carry more. Capital requirements are expressed as percentages of this total, not of total assets.
Worked Problem — From a Balance Sheet to a Capital Ratio
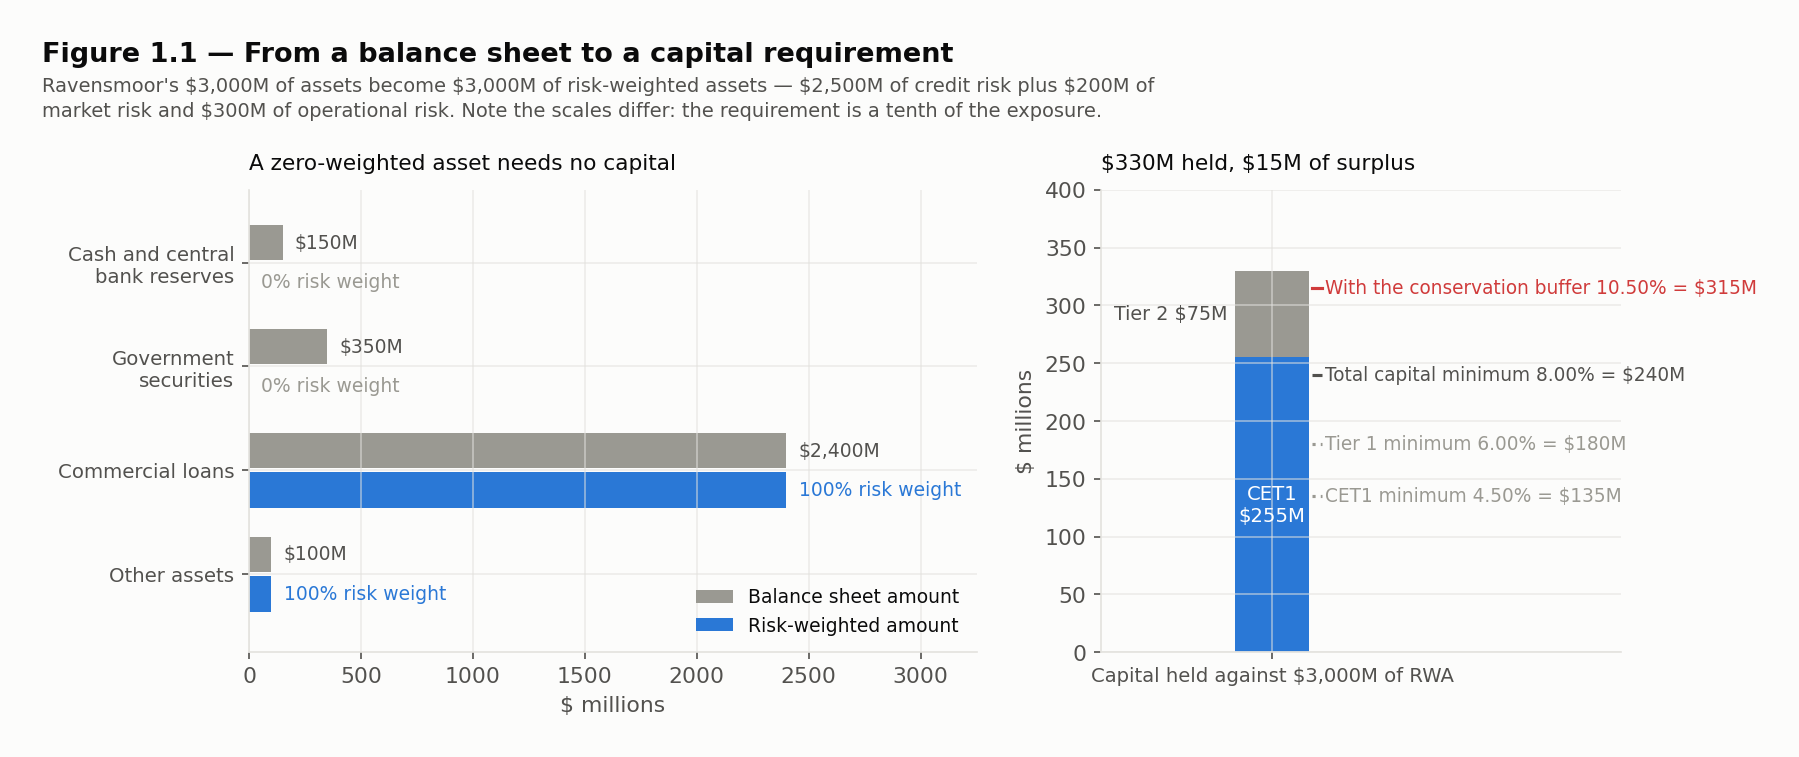
Problem. Ravensmoor's cash and central bank reserves and its government securities carry a 0% risk weight; its commercial loans and other assets carry 100%. Market risk adds $200 million of risk-weighted assets and operational risk adds $300 million. The group holds $255 million of common equity tier 1 capital and $75 million of tier 2 capital. Compute the group's risk-weighted assets, its CET1 ratio and its total capital ratio, and state its surplus over a 10.50% requirement.
Solution.
Step 1 — credit risk-weighted assets. Weight each asset class and add:
Half the balance sheet's headline size has vanished, because $500 million of it is cash and government paper that the framework treats as riskless.
Step 2 — total risk-weighted assets. Add the market and operational risk charges:
Step 3 — the ratios. Divide capital by total RWA:
Step 4 — the surplus. A 10.50% requirement on $3,000 million of RWA is $315 million of total capital. Ravensmoor holds $330 million, so its surplus is $15 million.
BA II Plus keystrokes: RWA and the Capital Ratios — Assets 150 / 350 / 2,400 / 100; market RWA 200, operational RWA 300; CET1 255, Tier 2 75
| Keys | Display | Note |
|---|---|---|
| 2400 + 100 = | → 2,500 | credit RWA — the zero-weighted assets drop out |
| + 200 + 300 = | → 3,000 | total RWA |
| STO 1 | park the denominator | |
| 255 ÷ RCL 1 = | → 0.085 | CET1 ratio 8.50% |
| 255 + 75 = ÷ RCL 1 = | → 0.11 | total capital ratio 11.00% |
| RCL 1 × 0.105 = | → 315 | requirement with the buffer |
| +/- + 330 = | → 15 | surplus, $15M |
A trap worth pre-empting
The equality of total assets and total risk-weighted assets here is an accident of the numbers, and the exam likes accidents of this kind. $500 million of assets weight to zero, and $500 million of market and operational risk RWA is added back. If a question gives you a balance sheet and a set of weights, never assume the two totals are related — compute the weighted sum.
1.3 Two Things Called Capital
Ravensmoor's board is about to be shown two capital numbers for the same loan book, and they will not match. They are not meant to. They answer different questions, and a candidate who cannot say which question each one answers will lose marks on this reading every time.
Economic capital The amount of capital a firm judges it needs to absorb unexpected losses to a confidence level of its own choosing, usually one tied to the credit rating it wants to keep. It is computed from the firm's own loss distribution: the distance from the mean of that distribution to a chosen high quantile.
Regulatory capital The amount of capital a supervisor requires the firm to hold, computed by applying a prescribed rule to prescribed exposure measures. It is a minimum imposed from outside, and the firm does not get to choose the confidence level, the model, or in many cases the inputs.
The distinction the exam tests most often is what each number is for.
| Economic capital | Regulatory capital | |
|---|---|---|
| Whose question | The firm's: how much loss can we absorb and survive with our target rating? | The supervisor's: how much loss must this firm absorb before depositors and the system are exposed? |
| Confidence level | Chosen by the firm, and tied to a target rating — 99.9% is common for a solid investment-grade bank | Implicit in the rules; the firm does not choose it |
| Inputs | The firm's own estimates of exposure, default probability, loss given default and correlation | Prescribed weights, or internal models within prescribed constraints |
| Diversification | Recognised — that is the main reason the number is lower | Recognised only where the rules allow it, and often not at all |
| Consequence of breach | A strategic problem: rating pressure, funding costs | A legal one: restrictions on distributions, supervisory intervention, ultimately resolution |
| Covers | Unexpected loss, above expected loss | Unexpected loss, on a standardised measure of exposure |
Both numbers sit above expected loss, and both exclude it. This is the second most tested point in the reading.
Expected Loss Is a Cost, Not a Risk
Expected loss is the mean of the loss distribution — the loss the book produces on average, year after year. A cost you expect is priced into the spread you charge and provisioned for in the accounts. It is not what capital is for.
Capital exists to absorb the unexpected part: the amount by which a bad year exceeds the average one. That is why every capital number in this chapter is measured from the mean of the distribution upwards, not from zero.
A bank that held capital against expected loss as well would be double-counting, having already charged its borrowers for it.
1.4 The Basel Regulations and What Motivated Them
Regulatory capital rules are easier to remember if you know what each generation was a reaction to. The exam asks for the requirements and their motivations.
Four decades of bank capital rules
- 1988: Basel I — A single credit-risk framework with four crude risk buckets and an 8% minimum against risk-weighted assets. Motivation: international banks, especially Japanese ones, were competing on thin capital, and supervisors wanted a level playing field plus a floor under the system.
- 1996: Market Risk Amendment — Trading positions get their own capital charge, computed from a value-at-risk model with supervisory multipliers. Motivation: Basel I charged nothing for price risk, and trading books had grown enormous.
- 2004: Basel II — Three pillars — minimum requirements, supervisory review, market discipline — with risk weights that vary with credit quality, an internal ratings based option, and the first capital charge for operational risk. Motivation: Basel I's four buckets let banks hold the riskiest asset in each bucket, which is regulatory arbitrage by construction.
- 2007-2009: The crisis — Banks that met their ratios failed anyway: capital was too little and of too low a quality, leverage was invisible to a risk-weighted ratio, and funding evaporated faster than solvency did.
- 2010 onwards: Basel III — More capital and better capital: CET1 4.50%, Tier 1 6.00%, total capital 8.00%, plus a 2.50% capital conservation buffer, a 0-2.50% countercyclical buffer and surcharges for globally systemic banks. A 3% leverage ratio that ignores risk weights entirely, and two liquidity standards — the liquidity coverage ratio and the net stable funding ratio.
- Finalisation: The output floor — Internally modelled RWA may not fall below 72.5% of what the standardised approach would give. Motivation: two banks holding the same portfolio were reporting RWA that differed by a factor of two, and the difference was the model, not the risk.
Four features of the current framework carry most of the exam's weight:
The three minimum ratios are nested. Common equity tier 1 — ordinary shares and retained earnings, the capital that absorbs loss while the bank is still a going concern — must be at least 4.50% of RWA. Tier 1, which adds certain perpetual instruments, must be at least 6.00%. Total capital, which adds tier 2 instruments such as subordinated debt, must be at least 8.00%. On Ravensmoor's $3,000 million of RWA those are $135 million, $180 million and $240 million.
The buffers sit on top and bite gradually. The capital conservation buffer of 2.50% is not a minimum whose breach closes the bank; it is a region within which distributions — dividends, buybacks, bonuses — are progressively restricted. That design is deliberate: a hard minimum gives a bank in trouble an incentive to shrink lending abruptly, while a buffer gives it a reason to retain earnings instead.
The leverage ratio is a deliberate crosscheck. Tier 1 capital divided by total exposure, with no risk weights at all, must be at least 3%. Its entire purpose is to catch the case where the risk weights are wrong. A bank stuffed with assets the model calls safe can satisfy a risk-based ratio and still be one bad assumption from insolvency.
The liquidity standards are separate from capital. The liquidity coverage ratio requires enough high-quality liquid assets to survive thirty days of a prescribed stress; the net stable funding ratio requires long-term assets to be funded with stable liabilities. Neither is a capital rule, and both exist because the crisis killed solvent banks.
Why regulation exists at all, in one sentence
A bank's failure imposes costs on people who were not party to its decisions — depositors, other banks, borrowers who lose their credit lines, taxpayers who fund the rescue. Those costs do not appear in the bank's own calculation of how much capital to hold, so the bank rationally holds less than the system needs. Capital regulation is the correction, and the moral hazard created by deposit insurance, which is §1.6's subject, makes the correction necessary rather than merely desirable.
1.5 The Same Loan Book, Measured Twice
Now put the two definitions to work on one portfolio.
Worked Problem — Two Capital Numbers on One Loan Book
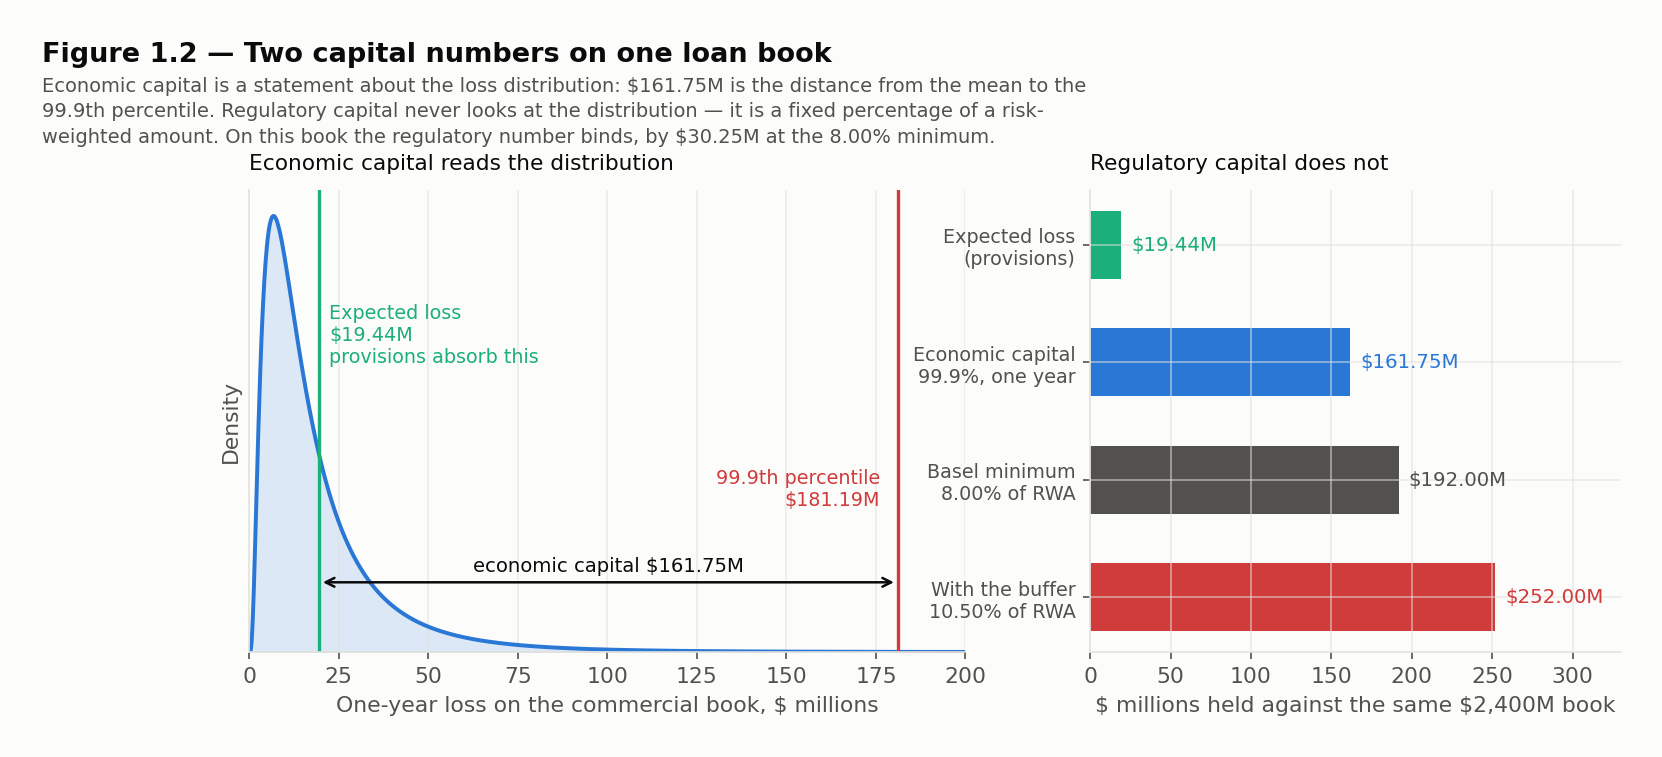
Problem. Ravensmoor's commercial loan book has an exposure at default of $2,400 million, a one-year default probability of 1.80% and a loss given default of 45%. The group's credit risk team has modelled the book's loss distribution and reports a 99.9th percentile one-year loss of $181.19 million. The book carries a 100% regulatory risk weight. Compute (a) the book's expected loss, (b) the economic capital it requires at 99.9%, and (c) the regulatory capital required against it at the 8.00% minimum and at the 10.50% level including the conservation buffer. State which requirement binds.
Solution.
Step 1 — expected loss. Expected loss is the product of the three credit drivers:
$19.44 million a year, on average. This is provisioned and priced into the loan spreads; it is not what either capital number covers.
Step 2 — economic capital. Economic capital is the distance from the mean of the loss distribution to the chosen quantile:
$161.75 million. Note what the subtraction is doing: the bank has already set aside $19.44 million, so capital only needs to cover the excess of a one-in-a-thousand year over an average one.
Step 3 — regulatory capital. The regulatory calculation never looks at that distribution. It applies a weight and then a percentage:
Step 4 — which binds. $192.00 million against $161.75 million: the regulatory minimum exceeds the bank's own assessment by $30.25 million, or 18.70%. Including the conservation buffer, $252.00 million exceeds it by $90.25 million, or 55.80%. On this book the regulator's number binds, and by a wide margin.
BA II Plus keystrokes: Two Capital Numbers on One Book — EAD 2,400, PD 1.80%, LGD 45%, 99.9% loss 181.19, risk weight 100%
| Keys | Display | Note |
|---|---|---|
| 2400 × 0.018 × 0.45 = | → 19.44 | expected loss $19.44M |
| +/- + 181.19 = | → 161.75 | economic capital at 99.9% |
| STO 1 | park it for the comparison | |
| 2400 × 0.08 = | → 192 | regulatory at the 8.00% minimum |
| - RCL 1 = | → 30.25 | regulatory exceeds economic by $30.25M |
| ÷ RCL 1 = | → 0.187 | by 18.70% |
| 2400 × 0.105 = | → 252 | with the conservation buffer |
Validation: the two capital numbers, and the gap between them
ead, pd, lgd = 2400.0, 0.0180, 0.45
loss_999, risk_weight = 181.19, 1.00

el = ead * pd * lgd
economic = loss_999 - el
reg_min = 0.0800 * ead * risk_weight
reg_buffered = 0.1050 * ead * risk_weight

print(f"expected loss (provisioned) : ${el:7,.2f}M")
print(f"economic capital at 99.9%   : ${economic:7,.2f}M")
print(f"regulatory at 8.00%         : ${reg_min:7,.2f}M  gap ${reg_min - economic:6,.2f}M  ({reg_min / economic - 1:+.2%})")
print(f"regulatory at 10.50%        : ${reg_buffered:7,.2f}M  gap ${reg_buffered - economic:6,.2f}M  ({reg_buffered / economic - 1:+.2%})")
print(f"binding requirement         : {'regulatory' if reg_min > economic else 'economic'}")
# Output:
# expected loss (provisioned) : $  19.44M
# economic capital at 99.9%   : $ 161.75M
# regulatory at 8.00%         : $ 192.00M  gap $ 30.25M  (+18.70%)
# regulatory at 10.50%        : $ 252.00M  gap $ 90.25M  (+55.80%)
# binding requirement         : regulatory
Hold on to that gap, because it is an incentive. Every dollar by which the regulatory number exceeds the economic one is a dollar of capital the bank must hold but does not believe it needs. A bank facing that gap has three options: hold the capital and accept a lower return on equity, take more risk on the same risk-weighted footprint — since the weight does not change when the book gets worse — or move the exposure off the balance sheet. §1.10 is what happens when Ravensmoor chooses the third.
The direction is not universal
Do not learn "regulatory exceeds economic" as a rule. It holds here because a 100% risk weight is punitive for a diversified book of good-quality corporate loans. Reverse the portfolio and the comparison reverses: a highly concentrated book, or one whose defaults are strongly correlated, can easily need more economic capital than the standardised rules demand, because the rules assume a degree of diversification the book does not have. What the exam tests is that you know the two numbers answer different questions and can compute both.
1.6 Deposit Insurance and the Put the Insurer Wrote
Ravensmoor funds $2,400 million of its balance sheet with insured customer deposits. Those depositors do not monitor the bank, do not read its accounts, and would not withdraw if they did. That is the point of deposit insurance: it stops runs by removing the reason to run.
It also creates the cleanest example of moral hazard in the curriculum.
Moral hazard A change in behaviour caused by being insulated from the consequences of that behaviour. Insurance creates it whenever the premium does not vary with the insured party's own choices.
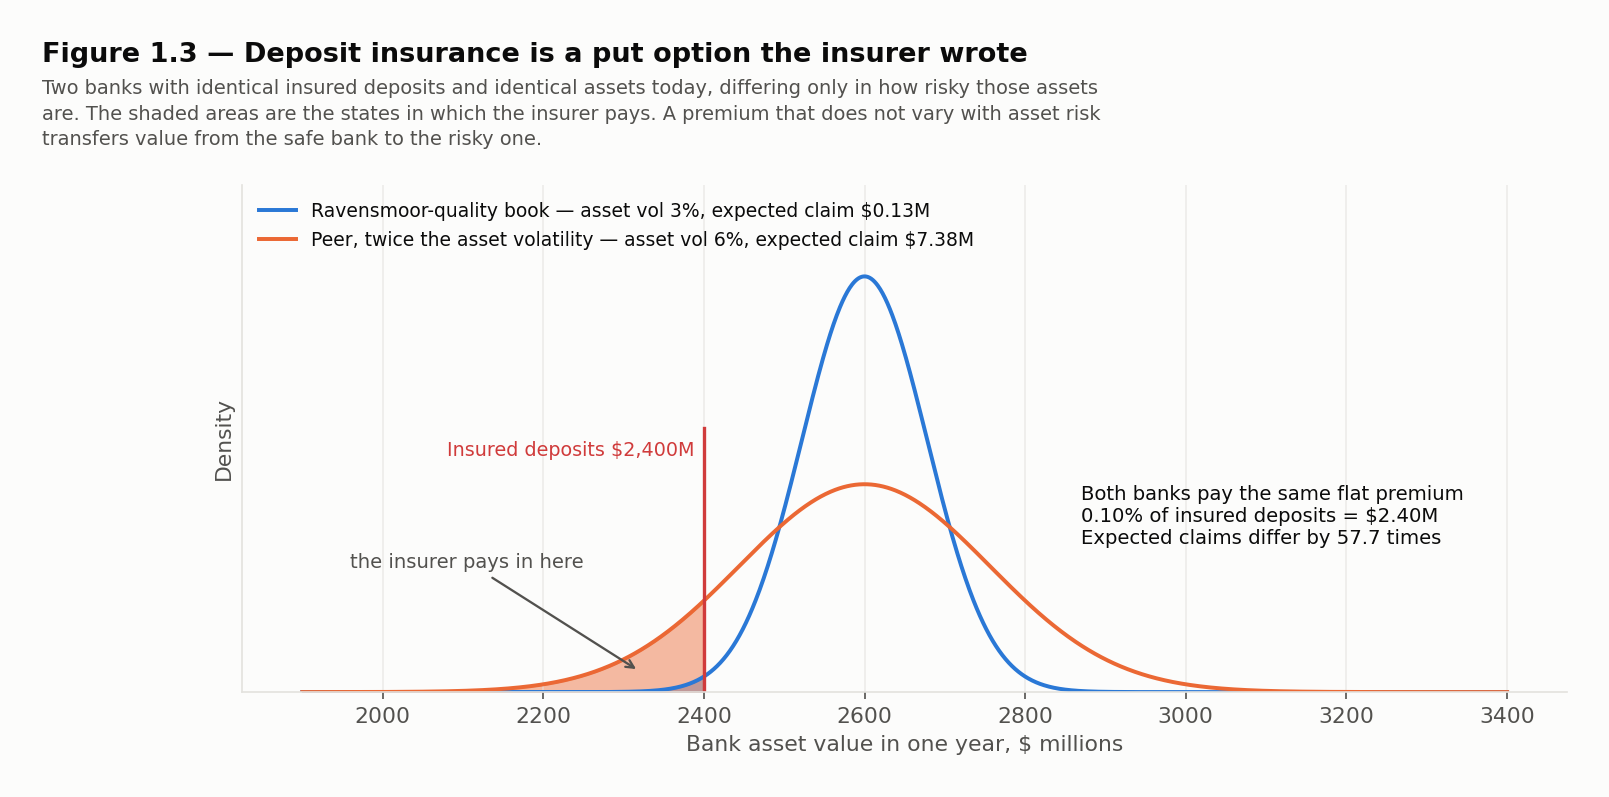
Think about who holds what. Insured depositors hold a claim that pays in full whatever happens, so they are indifferent to the bank's asset risk and will lend to it at the same rate regardless. Shareholders hold the residual, which is a call option on the bank's assets: they take the whole upside and their downside stops at zero. The deposit insurer holds the other side of that option — it has, in effect, written a put on the bank's assets, struck at the value of the insured deposits.
A put written on a more volatile asset is worth more. So the insurer's liability rises with the bank's asset risk while, under a flat premium, its income does not.
Worked Problem — What a Flat Deposit Insurance Premium Is Worth
Problem. Two banks each hold $2,600 million of assets funded by $2,400 million of insured deposits, and both pay the same deposit insurance premium of 0.10% of insured deposits. Over one year, each bank's asset value is normally distributed about its current value, with a standard deviation of 3.00% of assets for the first bank and 6.00% for the second. For a standard normal variable, the density at 2.564103 is 0.01490215 and the cumulative probability below −2.564103 is 0.00517215; at 1.282051 the density is 0.17538595 and the cumulative probability below −1.282051 is 0.09991233. Compute each bank's expected claim on the insurer and compare it with the premium paid.
Solution. The insurer pays whatever the deposits exceed the assets, and nothing when assets are sufficient — a payoff of . For a normally distributed with mean and standard deviation , that expectation is
Step 1 — the first bank. Its asset standard deviation is , and its cushion is , so
The bank is 2.56 standard deviations from the point at which the insurer pays, and the probability of getting there is . The expected claim is
About $0.13 million.
Step 2 — the second bank. Doubling the asset volatility halves the cushion in standard deviations: and , so the probability of a shortfall is . The expected claim is
About $7.38 million.
Step 3 — the comparison. Both banks pay , or $2.40 million. The second bank's expected claim is 57.67 times the first's. The safe bank overpays by $2.27 million a year; the risky bank underpays by $4.98 million. A fair, risk-based premium would be 0.0053% of deposits for the first bank and 0.3074% for the second — a factor of 58 between them, against a flat rate that is identical.
BA II Plus keystrokes: The Insurer's Expected Claim — A 2,600, D 2,400, sd 78.00 and 156.00; phi and Phi values given in the problem
| Keys | Display | Note |
|---|---|---|
| 2600 - 2400 = | → 200 | the cushion above insured deposits |
| ÷ 78 = | → 2.564103 | d for the safe bank |
| 78 × 0.01490215 = | → 1.162368 | sd x density |
| - ( 200 × 0.00517215 ) = | → 0.127938 | expected claim $0.13M |
| 200 ÷ 156 = | → 1.282051 | d for the risky bank |
| 156 × 0.17538595 = | → 27.360208 | sd x density |
| - ( 200 × 0.09991233 ) = | → 7.377742 | expected claim $7.38M |
| ÷ 0.127938 = | → 57.6665 | the risky bank costs ~58x as much |
Validation: a flat premium on two different banks
from scipy.stats import norm

assets, deposits, premium_rate = 2600.0, 2400.0, 0.0010

def expected_claim(vol):
    sd = assets * vol
    d = (assets - deposits) / sd
    return sd * norm.pdf(d) - (assets - deposits) * norm.cdf(-d)

premium = premium_rate * deposits
for vol in (0.03, 0.06):
    claim = expected_claim(vol)
    sd = assets * vol
    print(f"asset vol {vol:>5.0%}: sd ${sd:6,.2f}M  P(shortfall) {norm.cdf(-(assets - deposits) / sd):7.4%}  "
          f"expected claim ${claim:6.4f}M  fair premium {claim / deposits:.4%}")
print(f"flat premium paid by both  : ${premium:.2f}M")
print(f"ratio of expected claims   : {expected_claim(0.06) / expected_claim(0.03):.2f}x")
print(f"safe bank overpays ${premium - expected_claim(0.03):.4f}M, "
      f"risky bank underpays ${expected_claim(0.06) - premium:.4f}M")
# Output:
# asset vol    3%: sd $ 78.00M  P(shortfall) 0.5172%  expected claim $0.1279M  fair premium 0.0053%
# asset vol    6%: sd $156.00M  P(shortfall) 9.9912%  expected claim $7.3777M  fair premium 0.3074%
# flat premium paid by both  : $2.40M
# ratio of expected claims   : 57.67x
# safe bank overpays $2.2721M, risky bank underpays $4.9777M
The consequence is a subsidy that flows from prudent banks to risky ones, and an incentive for any bank to take more asset risk than it otherwise would — because the extra risk is funded at an insured deposit rate that does not move. Four things are done about it, and the exam expects you to be able to name them:
- Risk-based premiums. Tie the assessment to the bank's own risk profile and capital, so the price moves with the risk. In practice the range is narrow relative to the range of real risk, so this mitigates rather than solves.
- Capital requirements. Force shareholders to keep more of their own money at stake, which shrinks the value of the put by moving the strike further away.
- Supervision and prompt corrective action. Intervene while the bank is still solvent, imposing restrictions as capital ratios decline rather than waiting for failure.
- Coverage limits. Cap the insured amount per depositor, so that large depositors retain a reason to monitor — although in a crisis those are precisely the depositors who run.
The same structure appears twice more in this course
Deposit insurance is a written put whose premium does not vary with the risk being insured. Hold that shape: Chapter 2 finds it again in insurance guaranty funds, where surviving insurers are assessed after a failure rather than before, and Chapter 4 finds it again in a central counterparty's default fund, where surviving clearing members' contributions are consumed by the defaulter's losses.
1.7 How an Investment Bank Raises Money for a Client
Ravensmoor Securities, the group's investment banking arm, brings issuers to market. The curriculum names five arrangements, and the discriminator between them is always the same: who bears the risk that the securities do not sell at the expected price.
Private placement Securities are sold directly to a small number of large, sophisticated investors rather than offered to the public. Registration requirements are lighter and the process is faster and cheaper, but the investor base is narrower and the securities are less liquid, so the issuer typically accepts a lower price.
Public offering Securities are registered and offered to investors at large, usually through an underwriting syndicate. The process is slower and more expensive, with disclosure obligations, but it reaches the deepest pool of capital and produces a liquid, tradable security.
Within a public offering, the underwriter's role can be structured two ways.
Firm commitment. The underwriter buys the entire issue from the company at an agreed price and resells it to the public. The issuer's proceeds are certain the moment the agreement is signed. If the offering is mispriced, the loss is the underwriter's.
Best efforts. The underwriter acts as an agent, promising only to use its best efforts to place the securities, and earns a commission on what it sells. The issuer takes the price and quantity risk.
Dutch auction. Investors submit bids stating a quantity and a price. The bids are ranked from highest price down, and the clearing price is the price at which cumulative demand first covers the offering. Every successful bidder pays that same clearing price, whatever they bid.
Worked Problem — Three Routes to Market for One Share Issue
Problem. Kelbrook Industrial wants to raise capital by selling 10 million shares, and is choosing between three routes. Under a firm commitment, Ravensmoor Securities would buy the shares at $28.50 and offer them at $30.00. Under a best efforts arrangement, Ravensmoor would charge 3.00% of the proceeds it actually places, and the placement is expected to reach 8.2 million shares at $30.00. Under a Dutch auction, the bids received are 2.0 million shares at $32.00, 3.0 million at $31.00, 2.5 million at $30.00, 4.0 million at $29.00 and 3.0 million at $28.00. Compute the issuer's proceeds under each, and the underwriter's profit under the firm commitment if the shares can in fact only be placed at $27.00.
Solution.
Step 1 — firm commitment. The issuer receives the purchase price on every share, regardless of what happens next:
The underwriter's gross spread is $30.00 − $28.50 = $1.50 a share, or $15.00 million on a successful deal — 5.00% of the $300 million raised from the public.
Step 2 — firm commitment, deal breaks. If the shares clear at $27.00, the underwriter sells for $270.00 million what it paid $285.00 million for:
A loss of exactly the size of the fee it stood to earn. That symmetry is the point of the arrangement: the underwriter is paid for taking price risk, and the issuer's $285 million is untouched either way.
Step 3 — best efforts. The issuer receives only the proceeds of shares actually placed, net of commission:
The underwriter earns $7.38 million and risks nothing. The issuer is $46.38 million short of the firm commitment outcome and has no recourse.
Step 4 — Dutch auction. Rank the bids from the highest price down and accumulate:
| Bid price | Shares bid | Cumulative shares |
|---|---|---|
| $32.00 | 2.0M | 2.0M |
| $31.00 | 3.0M | 5.0M |
| $30.00 | 2.5M | 7.5M |
| $29.00 | 4.0M | 11.5M |
| $28.00 | 3.0M | 14.5M |
Cumulative demand first reaches 10 million shares at $29.00, so that is the clearing price and every successful bidder pays it — including those who bid $32.00. Only 2.5 million of the 4.0 million shares bid at $29.00 can be filled, so those bidders are allocated 62.50% of what they asked for. Proceeds are
Step 5 — the comparison. The auction raised $5.00 million more than the firm commitment and $51.38 million more than the best efforts placement, but it offered no guarantee: had demand been thinner, the clearing price would have fallen and the issuer would have borne it.
BA II Plus keystrokes: Three Routes to Market — 10M shares; firm commitment 28.50 / 30.00; best efforts 8.2M at 30.00 less 3.00%; auction clears at 29.00
| Keys | Display | Note |
|---|---|---|
| 10 × 28.5 = | → 285 | firm commitment proceeds, $285M |
| 30 - 28.5 = × 10 = | → 15 | underwriter's gross spread, $15M |
| 27 - 28.5 = × 10 = | → -15 | the same $15M, lost, if it clears at 27 |
| 8.2 × 30 = | → 246 | best efforts gross proceeds |
| × 0.97 = | → 238.62 | net of the 3.00% commission |
| 10 × 29 = | → 290 | auction proceeds at the clearing price |
| 2.5 ÷ 4 = | → 0.625 | fill rate for bids at the clearing price |
The distractor that catches everybody
In a Dutch auction, successful bidders pay the clearing price, not the price they bid. A question that gives you a bid schedule and asks for proceeds is testing exactly this: 2.0 million at $32.00 plus 3.0 million at $31.00 plus 2.5 million at $30.00 plus 2.5 million at $29.00 would be $304.50 million, and it is wrong. The uniform price is what makes bidders willing to bid their true valuation rather than shade it.
1.8 Conflicts of Interest Inside a Banking Group
Ravensmoor lends money, manages other people's money, and underwrites securities. Each of those is a respectable business. The trouble is that each one gives the group information or influence that could be used to the advantage of one client and the detriment of another.
The curriculum frames this as conflicts between three divisions.
| Conflict | How it arises | What it looks like in practice |
|---|---|---|
| Commercial banking against investment banking | The bank's lending relationship is leverage to win an underwriting mandate | Offering cheap credit conditional on the underwriting mandate — "tying" — or lending to a weak client so it can repay an issue the bank underwrote |
| Investment banking against securities services | Research and sales sit next to the underwriting fee | Analysts publishing favourable research on issues the bank is underwriting; placing a hard-to-sell issue with the bank's own asset management clients |
| Commercial banking against securities services | Confidential borrower information is valuable to traders and advisers | The credit file on a borrower reaching the trading desk, or the M&A team, before the market has it |
There is also a conflict between the bank and its own clients: the bank trades for its own account in the same securities it recommends, executes, and holds for customers.
The controls are the exam's answer and they layer:
- Information barriers. Restrict the flow of confidential information between divisions, supported by restricted and watch lists that block trading and research in names where the bank holds inside information.
- Separation of function and reporting line. Research is compensated and supervised outside investment banking, so an analyst's pay does not depend on deal fees. After the 2003 global research settlement this became a formal requirement rather than a courtesy.
- Legal separation. Distinct entities for distinct businesses, with their own capital and boards — the extreme version being the Glass-Steagall separation of commercial and investment banking in the United States, repealed in 1999 and partly reintroduced in different form afterwards.
- Disclosure and consent. Where a conflict cannot be eliminated, it is disclosed and the affected client consents — the mechanism the GARP Code of Conduct relies on.
- Supervision and escalation. A conflicts register, independent compliance review, and a route by which an employee can raise a conflict without going through the person who benefits from it.
A live example in this series
The Ravensmoor Core Equity Fund, which Chapter 2 examines as a product and Chapter 5 hedges with index futures, is managed by the same group that underwrites securities through Ravensmoor Securities. If the fund buys an issue Ravensmoor Securities is struggling to place, the fund's investors have paid for a problem that was not theirs. This is the conflict the Foundations course's treatment of the GARP Code addresses under loyalty to clients: the manager's duty runs to the fund's investors, not to the group's fee line, and the only defensible test is whether the purchase would have been made had the group had no interest in the issue.
1.9 The Banking Book and the Trading Book
Every position a bank holds sits in one of two books, and which one decides how it is valued, how it is capitalised, and — as Ravensmoor is about to discover — whether it appears in the right risk report at all.
Banking book Positions the bank intends to hold to maturity or for the longer term — chiefly loans and deposits. They are carried at amortised cost with provisions for credit losses, so day-to-day price movements do not reach the income statement, and they attract credit risk capital.
Trading book Positions held with intent to trade — to profit from short-term price movements or to hedge other trading positions. They are marked to market, so every price movement hits the income statement immediately, and they attract market risk capital.
| Banking book | Trading book | |
|---|---|---|
| Typical contents | Loans, deposits, held-to-maturity securities | Securities and derivatives held for short-term gain, and their hedges |
| Intent | Hold | Trade |
| Valuation | Amortised cost, with provisions | Fair value, marked to market daily |
| Earnings volatility | Low, until a credit event | Immediate and continuous |
| Capital charge | Credit risk RWA | Market risk capital |
| Liquidity assumption | Illiquid | Liquid enough to exit |
The boundary matters because the two capital treatments can give very different answers for the same economic exposure, which creates an incentive to place a position on the more favourable side. Before the crisis this was a well-worn route: credit exposures that would have attracted a full credit risk charge in the banking book were booked as trading positions and capitalised on a value-at-risk model calibrated to a calm period. The Fundamental Review of the Trading Book tightened the boundary precisely for that reason, making the classification harder to change after the fact and requiring supervisory approval to move a position across.
Where this bites in Ravensmoor's own numbers
The $30 million first-loss tranche that Ravensmoor retained from its securitization — the subject of the next section — is booked in the trading book. That choice was defensible on its face: the tranche is a security, and the desk that holds it quotes a price for it. But it put the group's single most concentrated credit exposure outside the perimeter of its credit risk aggregation, so the tranche's expected loss never reached the board's credit report. The regulation, as we are about to see, does not miss it.
1.10 Originate-to-Distribute, and What Ravensmoor's Programme Was Worth
Originate-to-distribute A banking model in which loans are made with the intention of selling them on — through outright sale, securitization, or credit derivatives — rather than holding them to maturity. The bank earns origination and servicing fees, recycles its funding and its capital into new lending, and transfers some part of the credit risk to investors.
The benefits are real and the exam expects them: the bank's funding and capital are no longer tied up for the life of the loan, so the same balance sheet supports more lending; fee income replaces spread income and is less capital-hungry; the bank can shed concentrations it cannot otherwise diversify away; and credit reaches borrowers who could not have been funded from deposits alone.
The drawbacks are equally examinable, and all of them are versions of one problem — the originator no longer bears the consequence of a bad loan:
- Weakened screening and monitoring. Underwriting standards slip when the loan is going to be sold in ninety days. This is the mechanism behind the subprime deterioration of 2004-2007.
- Asymmetric information and adverse selection. The originator knows which loans are worse and keeps or sells accordingly. Investors, knowing this, discount the whole pool.
- Opacity. Repackaging into tranches, and tranches into further structures, made the ultimate exposure very hard to locate.
- Warehousing risk. Between origination and distribution the loans sit on the bank's balance sheet, and that pipeline is exactly what froze in 2007.
- Implicit recourse and reputational risk. Banks that had legally sold exposures supported the vehicles anyway, because failing to do so would have destroyed their franchise.
- Procyclicality. The model works in good markets and stops working in bad ones, withdrawing credit precisely when it is most needed.
Now to Halvorsen's second board question. Last year Ravensmoor sold $600 million of loans into a securitization and bought credit protection on a further $200 million single-name concentration. The finance division reported the programme as releasing $60.80 million of regulatory capital.
Worked Problem — Capital Relief, Claimed and Delivered
Problem. Ravensmoor's credit risk-weighted assets before the programme are $2,500 million, and the minimum total capital requirement is 8.00% of RWA. The programme did three things: it removed $600 million of 100%-weighted loans from the balance sheet; it left Ravensmoor holding a $30 million retained first-loss tranche, which attracts a 1250% risk weight; and it hedged $200 million of exposure with a credit default swap bought from Meridian Bank, which under the substitution approach replaces the borrower's 100% risk weight with Meridian's 20%. The loans sold had a default probability of 1.20%; the hedged $200 million carries the book's average of 1.80%; loss given default is 45% throughout. Compute the capital relief actually delivered, compare it with the $60.80 million claimed, and compute the expected loss the programme moved off Ravensmoor's books.
Solution.
Step 1 — what the sale removes. Selling $600 million of loans at a 100% weight removes $600 million of RWA, which at 8.00% is $48.00 million of capital. This is the number the finance division stopped at.
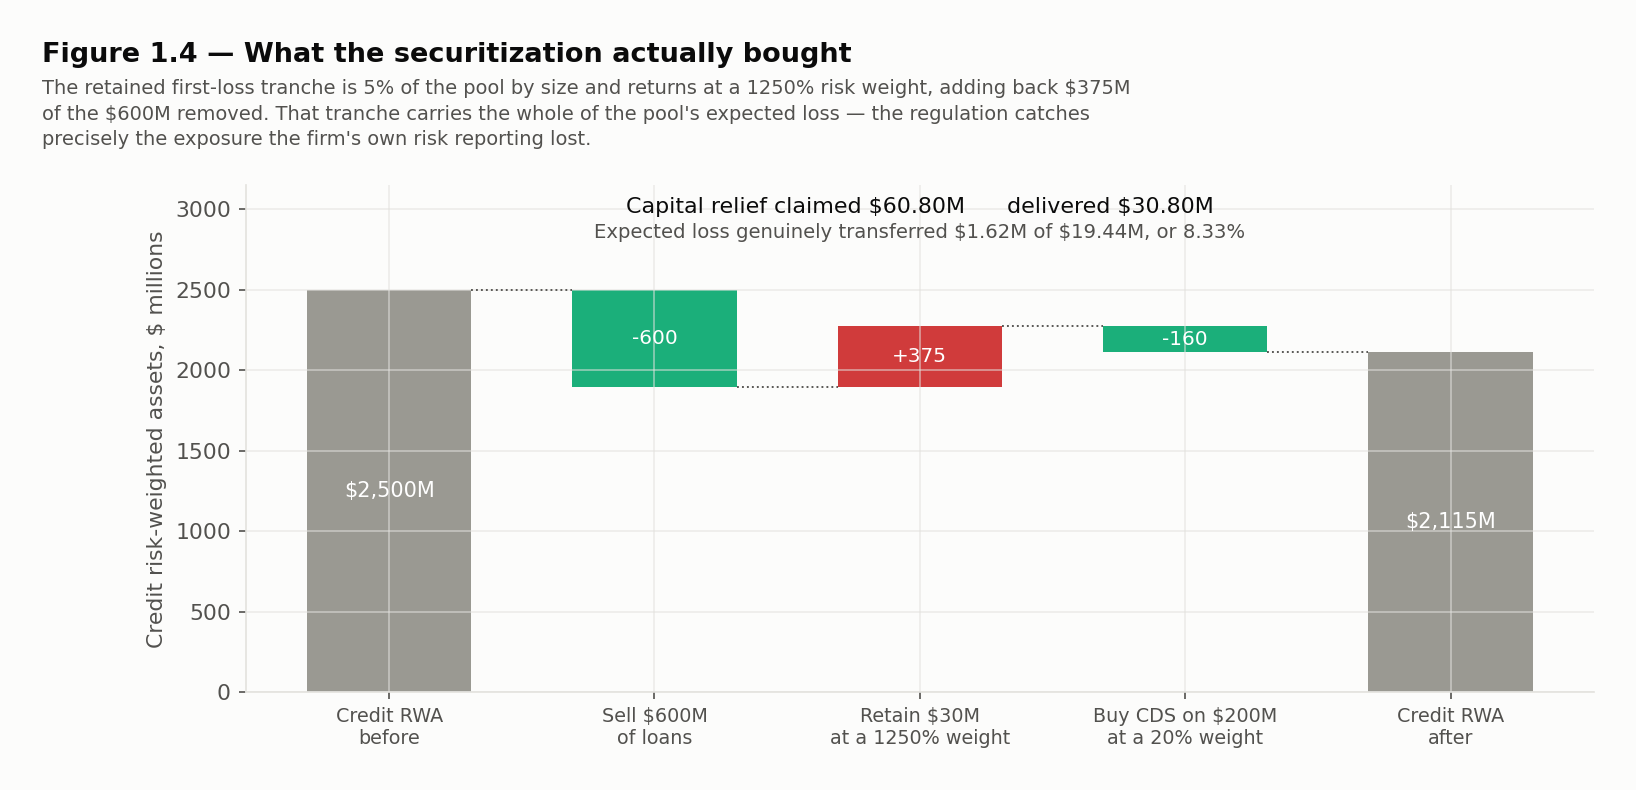
Step 2 — what the retained tranche adds back. A 1250% risk weight is not an arbitrary penalty. It is the weight that makes capital equal to the exposure: . Because , a 1250% weight is a full, dollar-for-dollar deduction, and it is applied to retained first-loss pieces precisely because a first-loss piece absorbs losses before anything else does.
So the sale's net effect on risk-weighted assets is not −$600 million but
The retained tranche claws back $30.00 million of the $48.00 million claimed.
Step 3 — what the credit default swap delivers. Substituting Meridian's 20% weight for the borrowers' 100% on $200 million of exposure:
Note the swap does not eliminate the requirement. It exchanges credit exposure to the borrowers for credit exposure to Meridian, and the capital falls because Meridian is judged the better credit — not because the risk has gone.
Step 4 — the total. Relief delivered is $18.00 + $12.80 = $30.80 million, against $60.80 million claimed. Credit RWA falls from $2,500 million to
and total RWA from $3,000 million to $2,615 million, lifting the CET1 ratio from 8.50% to .
Step 5 — the expected loss that moved. The pool sold carries , so $3.24 million a year — but it sits inside the $30 million tranche Ravensmoor kept, which absorbs almost all of it, so in expectation very little of it left. The hedged slice carries , so $1.62 million, and that does leave, to Meridian. Expected loss moved: $1.62 million, or 8.33% of the book's $19.44 million. Relief per dollar of expected loss moved: .
BA II Plus keystrokes: Capital Relief, Claimed and Delivered — Credit RWA 2,500; sell 600 at 100%; retain 30 at 1250%; CDS on 200 at 20%; minimum 8.00%
| Keys | Display | Note |
|---|---|---|
| 600 × 0.08 = | → 48 | the claim: $48M from the sale |
| 30 × 12.5 = | → 375 | retained tranche RWA at a 1250% weight |
| 600 - 375 = | → 225 | net RWA actually removed by the sale |
| × 0.08 = | → 18 | relief delivered by the sale, $18M |
| STO 1 | ||
| 200 - ( 200 × 0.2 ) = | → 160 | RWA removed by the CDS |
| × 0.08 = | → 12.8 | relief from the hedge, $12.8M |
| + RCL 1 = | → 30.8 | total delivered, against $60.8M claimed |
| 255 ÷ 2615 = | → 0.097514 | CET1 ratio rises to 9.75% |
Validation: what the programme actually released
credit_rwa, min_ratio = 2500.0, 0.0800
sold, tranche, tranche_weight = 600.0, 30.0, 12.5
cds_notional, protection_weight = 200.0, 0.20

claimed = min_ratio * (sold + cds_notional * (1 - protection_weight))
sale_rwa = -sold + tranche * tranche_weight
cds_rwa = cds_notional * protection_weight - cds_notional
delivered = min_ratio * -(sale_rwa + cds_rwa)

ead, pd, lgd = 2400.0, 0.0180, 0.45
el = ead * pd * lgd
el_transferred = cds_notional * pd * lgd        # only the hedged slice leaves

print(f"claimed relief            : ${claimed:6,.2f}M")
print(f"  sale, gross             : ${min_ratio * sold:6,.2f}M")
print(f"  retained tranche RWA    : ${tranche * tranche_weight:6,.2f}M  -> claws back ${min_ratio * tranche * tranche_weight:5,.2f}M")
print(f"  hedge                   : ${min_ratio * -cds_rwa:6,.2f}M")
print(f"delivered relief          : ${delivered:6,.2f}M   overstated by ${claimed - delivered:5,.2f}M")
print(f"credit RWA                : ${credit_rwa:,.2f}M -> ${credit_rwa + sale_rwa + cds_rwa:,.2f}M")
print(f"expected loss transferred : ${el_transferred:5,.2f}M of ${el:,.2f}M = {el_transferred / el:.2%}")
print(f"relief per dollar of EL   : {delivered / el_transferred:,.2f}x")
# Output:
# claimed relief            : $ 60.80M
#   sale, gross             : $ 48.00M
#   retained tranche RWA    : $375.00M  -> claws back $30.00M
#   hedge                   : $ 12.80M
# delivered relief          : $ 30.80M   overstated by $30.00M
# credit RWA                : $2,500.00M -> $2,115.00M
# expected loss transferred : $ 1.62M of $19.44M = 8.33%
# relief per dollar of EL   : 19.01x
The finding, and it is not about arithmetic
Set the two questions side by side.
How much capital did the programme release? $30.80 million — half what was reported, because a retained first-loss tranche returns at a 1250% weight.
How much expected loss did it transfer? The $600 million sold was the strongest quarter of the book, at a default probability of 1.20% against the book's 1.80%, and the $30 million tranche Ravensmoor kept absorbs almost all of that pool's $3.24 million expected loss. Only the $200 million hedged with the credit default swap genuinely left, carrying $1.62 million of expected loss — 8.33% of the book's $19.44 million.
So the programme bought $30.80 million of capital relief for $1.62 million of expected loss transferred: $19.01 of relief per dollar of expected loss moved. Expected loss is not the whole story — §1.3 taught that capital exists for the unexpected part, and the sale did pass the pool's tail, the rare years when losses break through the $30 million tranche, to the investors in the senior notes. But the losses Ravensmoor should actually expect to bear barely changed. That is not a criticism of the transaction — capital relief is a legitimate reason to do one — but it is a very different transaction from the one the board was told about: the $30.00 million overstatement alone is more than eighteen times the expected loss that moved.
Notice which control caught it. The group's own credit risk report missed the retained tranche entirely, because the tranche sits in the trading book, outside the credit aggregation perimeter (§1.9). The Basel framework caught it, because a 1250% risk weight applies to a retained first-loss position wherever it is booked. The regulation found precisely the exposure the firm's own risk reporting lost.
1.11 Putting It All Together
Halvorsen's board memo has to hold four numbers in one frame, and the frame is the chapter.
The group is adequately capitalised, with little room. $3,000 million of risk-weighted assets requires $315 million of total capital once the conservation buffer is included, against $330 million held — a surplus of $15 million, or half a percent of RWA. That is enough to satisfy the requirement and not enough to absorb a bad quarter without restricting distributions.
The binding constraint on the loan book is the regulator's, not the bank's. Ravensmoor's own model says $161.75 million of capital covers a one-in-a-thousand year on the commercial book; the rules require $192.00 million at the minimum and $252.00 million with the buffer. The $30.25 million gap is not an error by either party. It is the price of a rule that has to work for every bank, applied to a book that happens to be better than the average one the rule was written for.
That gap is a standing incentive to move exposure off the balance sheet, and Ravensmoor acted on it. The programme was worth doing and worth reporting honestly: $30.80 million of capital released, the CET1 ratio up from 8.50% to 9.75%, and 8.33% of the book's expected loss genuinely transferred. What cannot be defended is the $60.80 million figure, which counted the sale and ignored what was kept.
And the cheapest funding on the balance sheet is cheap because someone else is bearing part of its risk. $2,400 million of insured deposits fund the group at a rate that does not vary with what the group does with the money. The flat premium means a bank with twice Ravensmoor's asset volatility would pay the same $2.40 million for an expected claim 57.67 times larger. Every capital rule in §1.4 exists, in the end, to make that arrangement survivable.
The thread running through all four is the one this course keeps returning to: a market — or a regulator, or an insurer — lets you move a risk, at a price, and never all of it. The securitization moved a third of the notional and a twelfth of the risk. The credit default swap moved credit exposure from borrowers to Meridian Bank rather than removing it. Deposit insurance moved run risk from the bank to the insurer, and created a new risk in doing so. Each transfer is real, each is partial, and each leaves a residue that someone owns whether or not the reporting says so.
Chapter Summary
- A bank's major risks are credit, market, operational and liquidity — and liquidity splits into funding and market liquidity risk. Classify by cause, not symptom: a limit breach followed by a market loss is an operational failure.
- Risk-weighted assets weight each exposure by its riskiness; zero-weighted assets consume no capital. Ravensmoor's $3,000 million of assets produce $2,500 million of credit RWA, plus $200 million of market risk and $300 million of operational risk RWA, for $3,000 million in total.
- Economic capital is the firm's own answer, measured from its loss distribution as the distance from the mean to a chosen quantile: $181.19 − $19.44 = $161.75 million at 99.9%. Regulatory capital is a rule applied to a weighted exposure: $192.00 million at 8.00%, $252.00 million with the conservation buffer. Both sit above expected loss, which is provisioned rather than capitalised.
- The Basel minimum ratios are CET1 4.50%, Tier 1 6.00% and total capital 8.00% of RWA, with a 2.50% conservation buffer restricting distributions rather than forcing closure, a countercyclical buffer of 0-2.50%, a 3% leverage ratio that ignores risk weights as a crosscheck, and the LCR and NSFR liquidity standards.
- Deposit insurance is a written put, struck at insured deposits. Its value rises with asset volatility while a flat premium does not: for two banks with identical deposits, expected claims of $0.13 million and $7.38 million against the same $2.40 million premium — a ratio of 57.67 times. Risk-based premiums, capital requirements, supervision and coverage limits mitigate it.
- Financing arrangements differ in who bears price risk. Firm commitment: the underwriter, which is why the $15.00 million spread becomes a $15.00 million loss if the issue clears $1.50 below the purchase price. Best efforts: the issuer. Dutch auction: the issuer, with every successful bidder paying the clearing price of $29.00 regardless of what they bid.
- Conflicts of interest across lending, securities services and investment banking are managed with information barriers, separation of research from banking, legal separation, disclosure and consent, and independent supervision.
- The banking book holds positions intended to be held, at amortised cost, with credit risk capital; the trading book holds positions intended to be traded, marked to market, with market risk capital. The boundary invites arbitrage, which is why it is now hard to cross.
- Originate-to-distribute recycles capital and funding but weakens screening, because the originator no longer bears the consequence. Ravensmoor's programme delivered $30.80 million of relief against $60.80 million claimed — the difference being a $30 million retained tranche at a 1250% risk weight, which is a full deduction because 1/0.08 = 12.5 — and transferred 8.33% of the book's expected loss, or $19.01 of capital relief per dollar of expected loss moved.
What's Next
Chapter 2 moves from the bank to the three institutions that hold everybody else's savings: insurers, pension plans and funds. The arithmetic changes — mortality tables, combined ratios, incentive fees — but the question does not. Ravensmoor General's combined ratio turns out to be exactly 100.00%, which means its underwriting breaks even to the cent and every dollar of its profit is investment income earned on policyholders' money. The Absolute Return Fund's 2-and-20 takes 40.52% of a three-year gross gain while the investor carries the whole of the drawdown.
The Core Equity Fund, whose beta of 1.15 does all the work in Chapter 5, is introduced there as a product: its net asset value, its fee drag, and what its reported performance would look like if the funds that closed were still in the index.
Concept Checks
Fast recall before the exam-format questions — no calculator needed.
-
A trader exceeds an approved position limit without detection. Three days later the market moves against the position and the bank records a large loss. The loss is best classified as:
- Market risk, because the loss was realised through an adverse movement in market prices
- Business risk, because the desk's trading strategy proved to be unprofitable in that period
- Operational risk, because it follows from a failure of the bank's internal controls
- Liquidity risk, because the position could not be reduced before the market moved against it
-
A bank holds a large position in a thinly traded corporate bond. It is solvent and can meet every obligation falling due, but when it tries to sell the position quickly it can only do so 6% below the price at which the position is marked. This is best described as:
- Market liquidity risk, because the loss arises from the position's size relative to the depth of the market
- Funding liquidity risk, because the bank is selling assets in order to meet an obligation that is falling due
- Credit risk, because the discount implies the market is pricing a deterioration in the issuer's credit quality
- Market risk, because the loss is realised through a movement in the price at which the bond can be sold
-
A bank's economic capital for its loan book is materially lower than the regulatory capital required against the same book. Which statement is correct?
- The bank has made an error, since economic capital is by construction at least as large as the regulatory requirement
- The two figures answer different questions, and the bank must still hold the regulatory amount
- The bank may hold the lower amount, provided it documents its model and discloses the difference to its supervisor
- The difference should be added to loan loss provisions, since it represents expected loss the model has not recognised
-
A loan portfolio has an expected loss of $19.44 million a year. Which statement about how that amount is treated is correct?
- It is the amount of capital the bank is required to hold against the portfolio
- It is added to economic capital to give the portfolio's total loss-absorbing requirement
- It is disregarded in risk management, because only unexpected losses can threaten a bank's solvency
- It is priced into loan spreads and covered by provisions, with capital covering losses beyond it
-
A bank's common equity tier 1 ratio falls to a level inside the capital conservation buffer range. The immediate consequence is:
- the bank is treated as having breached its minimum requirement and is placed into resolution
- restrictions on the bank's dividends, share buybacks and discretionary bonus payments
- an automatic increase in the bank's risk weights until the ratio is restored to the buffer's top
- an obligation to raise the full shortfall in new common equity within thirty days of the breach
-
The Basel leverage ratio requires tier 1 capital to be at least 3% of a bank's total exposure measure, with no risk weighting applied at all. Its purpose is best described as:
- replacing the risk-based capital ratios with a single measure that banks are unable to dispute
- capturing the operational and liquidity risks that the risk-based capital ratios leave uncovered
- providing a backstop that binds when risk weights understate a portfolio's true risk
- ensuring that a bank holding government securities is treated identically to one holding corporate loans
-
Why does deposit insurance charged at a flat rate create a moral hazard problem?
- Because insured depositors have no incentive to monitor the bank, and so will withdraw their funds at the first sign of trouble whatever premium has been charged
- Because the premium is assessed on deposits rather than on assets, so a bank can reduce what it pays by funding itself in the wholesale market instead
- Because the bank's funding cost does not rise with its asset risk, so shareholders capture the upside of additional risk while the insurer bears the downside
- Because the insurance fund is mutualised, so a failure is paid for by the surviving banks rather than by the shareholders of the bank that failed
-
An issuer wants certainty about the amount it will raise from a share offering and is willing to pay for that certainty. The arrangement that provides it is:
- a best efforts offering, in which the underwriter commits to place as many shares as the market will absorb, though it is under no obligation to place them all
- a Dutch auction, in which the clearing price is determined by the bids investors themselves submit
- a private placement, in which the price is negotiated directly with a small group of institutional buyers
- a firm commitment offering, in which the underwriter buys the entire issue at an agreed price before reselling
-
A bank's equity research analysts are supervised and paid within the investment banking division, which earns fees from underwriting the companies those analysts cover. The control that most directly addresses this conflict is:
- moving research's reporting line and compensation outside investment banking altogether
- requiring each analyst to disclose personal shareholdings in the companies they cover
- placing companies being underwritten on a restricted list for the duration of the offering
- having the bank's asset management arm review research reports before they are published
-
The principal criticism of the originate-to-distribute model is that it:
- concentrates credit risk in the originating bank instead of dispersing it among investors
- weakens the originator's incentive to screen and monitor borrowers whose loans it will sell
- requires a bank to hold more regulatory capital than holding the loans to maturity would
- prevents a bank from earning fee income on the loans it does not retain on its balance sheet
Exam-Style Practice
Standalone four-option questions at the real exam's pace — 2.4 minutes each.
Chapter 1 — Banks: Risks, Capital and the Business Model
-
A bank holds $500 million of cash and government securities at a 0% risk weight, $1,800 million of corporate loans at a 100% risk weight and $200 million of other assets at a 100% risk weight. Market risk adds $150 million of risk-weighted assets and operational risk adds $250 million. The bank holds $190 million of common equity tier 1 capital. Its CET1 ratio is closest to:
- 7.60%
- 7.92%
- 9.50%
- 6.55%
-
A bank's $1,500 million loan book has a one-year expected loss of $12 million and a modelled 99.9th percentile one-year loss of $96 million. The book carries a 100% risk weight and the minimum total capital requirement is 8.00%. The amount by which the regulatory requirement exceeds the book's economic capital is closest to:
- $24 million
- $84 million
- $108 million
- $36 million
-
A bank reports $4,200 million of risk-weighted assets. Under Basel III, the minimum amount of common equity tier 1 capital it must hold, including the capital conservation buffer, is closest to:
- $294 million
- $189 million
- $441 million
- $357 million
-
Two banks hold the same amount of assets, fund them with the same amount of insured deposits, and pay the same flat deposit insurance premium. One holds short-dated government bonds; the other holds an equal amount of volatile commercial real estate loans. Which statement is correct?
- The premium is fair for both, because the insured deposits are the same size and so the insurer's largest possible loss is identical
- The bond bank subsidises the loan bank only if the loan bank actually fails, since until then neither has received anything
- The loan bank receives a subsidy, because the insurer's expected claim rises with the volatility of the bank's assets
- The loan bank pays too much, because the higher yield on its loans builds the cushion that keeps it further from insolvency
-
A company offers 12 million shares through a Dutch auction. The bids received are 3 million shares at $41.00, 2 million at $40.00, 4 million at $38.00, 5 million at $36.00 and 2 million at $35.00. The proceeds the company raises are closest to:
- $463 million
- $456 million
- $420 million
- $432 million
-
An underwriter agrees a firm commitment to buy 8 million shares from an issuer at $22.40 and to offer them to the public at $24.00. Demand proves weak and the entire issue is placed at $21.10. The underwriter's result on the transaction is closest to:
- a profit of $12.80 million
- a loss of $10.40 million
- a loss of $23.20 million
- no profit or loss, because the issuer bears the shortfall under a firm commitment
-
A bank buys a corporate bond intending to hold it to maturity and records it in the banking book. Two years later it decides to hold the bond for short-term trading gains and reclassifies it into the trading book. Which statement about the consequences is correct?
- The capital charge is unchanged, because the exposure to the issuer's credit quality is the same in either book
- The bond moves from a market risk charge to a credit risk charge, and from fair value to amortised cost, so earnings become less volatile
- The bond moves from a credit risk charge to a market risk charge, and from amortised cost to fair value, so price movements reach earnings at once
- The classification is an internal reporting matter, and supervisors allow a bank to move positions between the books at its own discretion
-
A bank securitizes $800 million of loans that carried a 100% risk weight and retains a $40 million first-loss tranche, which attracts a 1250% risk weight. The minimum total capital requirement is 8.00%. The capital relief the securitization delivers is closest to:
- $24 million
- $64 million
- $60.80 million
- $104 million
-
A bank has $500 million of exposure to corporate borrowers carrying a 100% risk weight and buys credit protection on the whole amount from a bank counterparty carrying a 20% risk weight. Under the substitution approach, with a minimum total capital requirement of 8.00%, the capital relief is closest to:
- $8 million
- $32 million
- $40 million
- $100 million
-
Two banks hold loan portfolios of identical size, default probability and loss given default, and both portfolios carry a 100% regulatory risk weight. The first is spread across 400 borrowers in unrelated industries; the second is concentrated in 20 borrowers in a single industry. Which statement is correct?
- The regulatory requirement and the economic capital are identical for both, because the inputs to both calculations are identical
- The second portfolio attracts a higher regulatory requirement, because concentration raises the applicable risk weight
- The second portfolio has the higher expected loss, and the additional economic capital is what covers that difference
- The regulatory requirements are identical, while the second portfolio needs more economic capital because its losses are more correlated
Get the full course: FRM Level I: Financial Markets and Products I